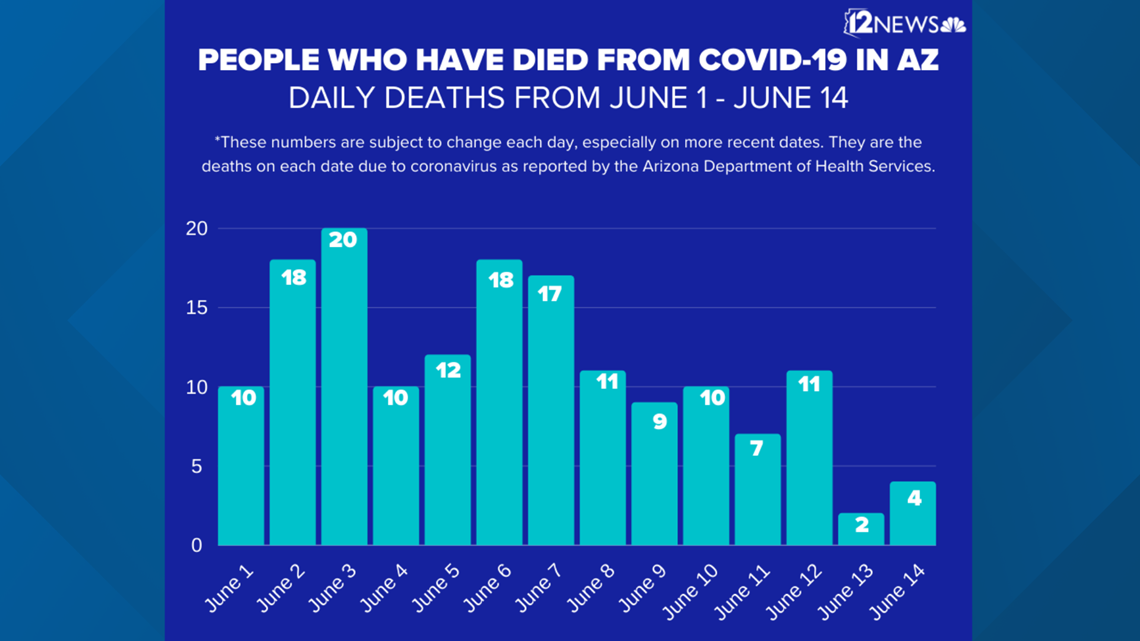
TEMPE, Ariz. — Arizona reported a record-high number of coronavirus cases in a single day on Tuesday, when 2,392 new cases were reported.
While the Arizona Department of Health Services coronavirus dashboard has been the main source for numbers and data in the state, there's another option available to view coronavirus data in Arizona, and nationally.
Arizona State University's Biodesign Institute has its own dashboard that shows critical COVID-19 trends in Arizona.
In addition to the cumulative case numbers and cumulative deaths updated daily, ASU has been tracking other trends in Arizona and nationally.
"The data for the last week of May and beginning of June reflect an accelerated rate at which new positive cases are being confirmed compared to the previous week," the Biodesign Institute writes on the dashboard.
"The number of hospital beds in the state dedicated to treating coronavirus patients has also increased. Currently, it is difficult to say whether there is an influence of increased temperatures on the transmission of the virus."
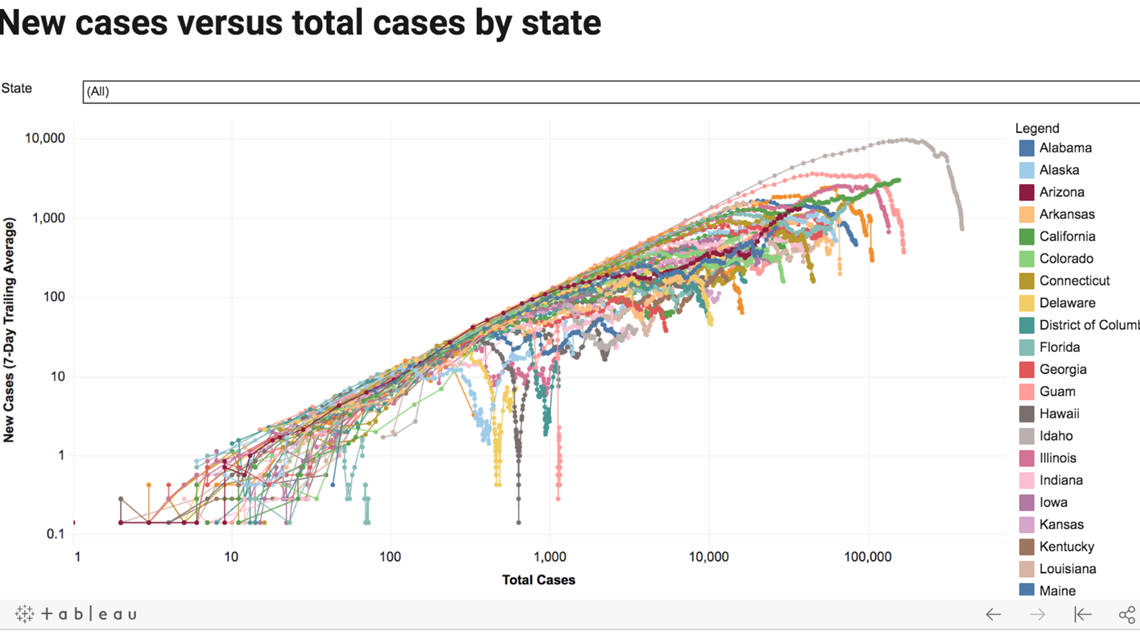
Josh LaBaer, the executive director of the Biodesign Institute, says the most useful chart for him are the color-coordinated graphs showing a moving 7-day average of new cases compared to total cases by county in Arizona and by state nationwide, displaying the rate at which new cases are appearing.
When the graph moves downward, there is a reduction in new cases. When it moves horizontally, new cases appear daily at a consistent rate and when it moves up and to the right, new cases are growing day-over-day.
It shows the same data in a graph state by state. Certain states can be selected to show one, or more to compare.


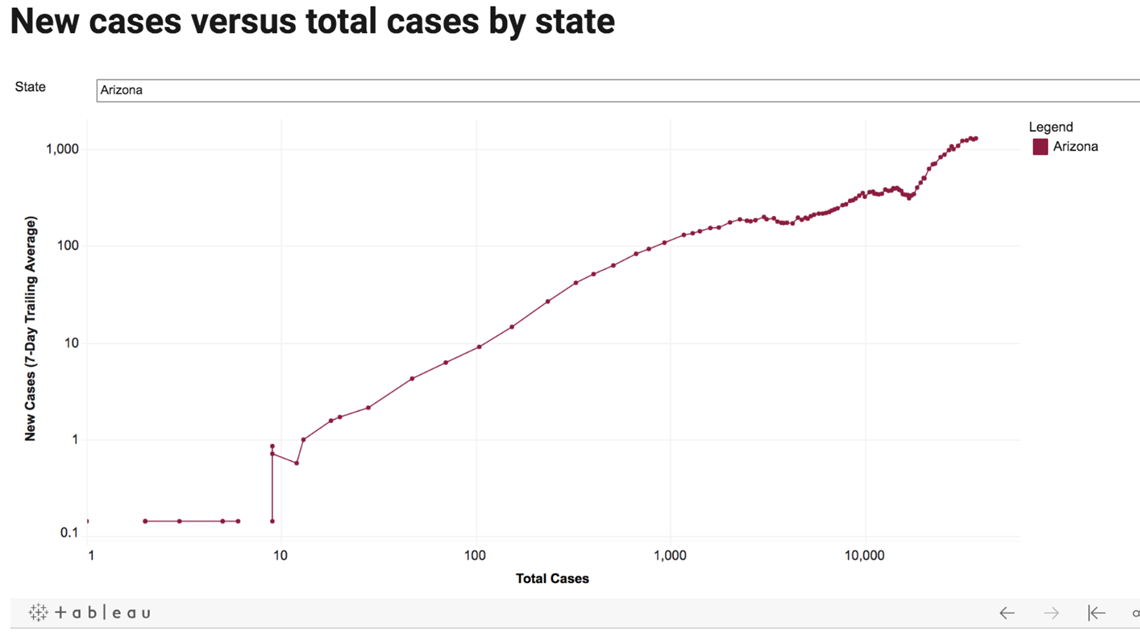


The data shows since the end of May how Arizona cases have been consistently higher than the 7-day trailing average as the graph continues to move up and to the right. LaBaer says it shows where Arizona does not want to be and that it indicates the spreading of the virus.
You can watch the full Wednesday press conference with Arizona State's Biodesign Institute below:
National data sets include a U.S. map of total cases per 100,000 people by state and another map that goes by county through the U.S.


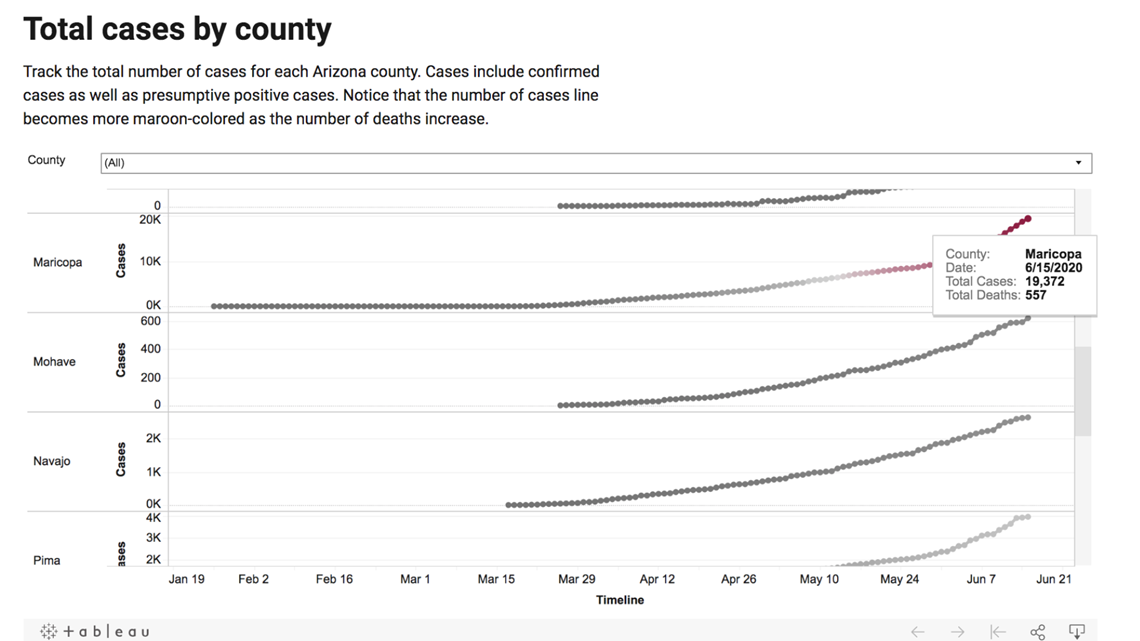
Arizona-specific data includes a visual representation of total cases by county since January, showing the trend line.
The data includes daily positive tests in Arizona, daily tests and hospital metrics that show graphs of hospital-specific data in the state like inpatient COVID-19 patients, COVID-19 patients seen in emergency departments, ICU beds in use for COVID-19 and more.
The graphs and tables can be interacted with and dates can be changed to see the data over a longer period of time.

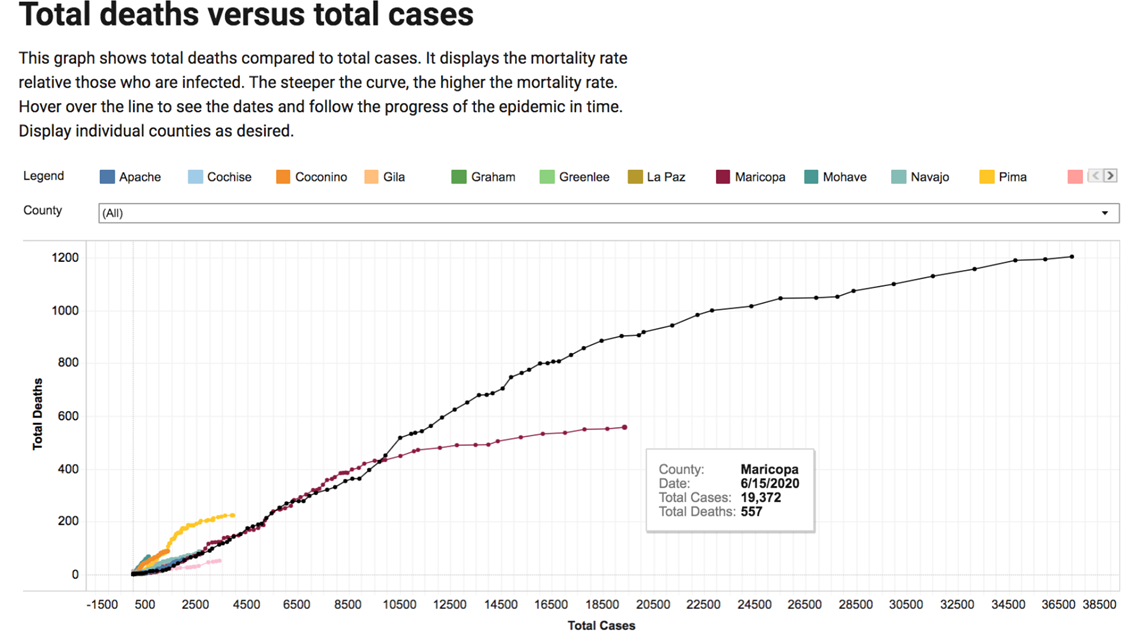
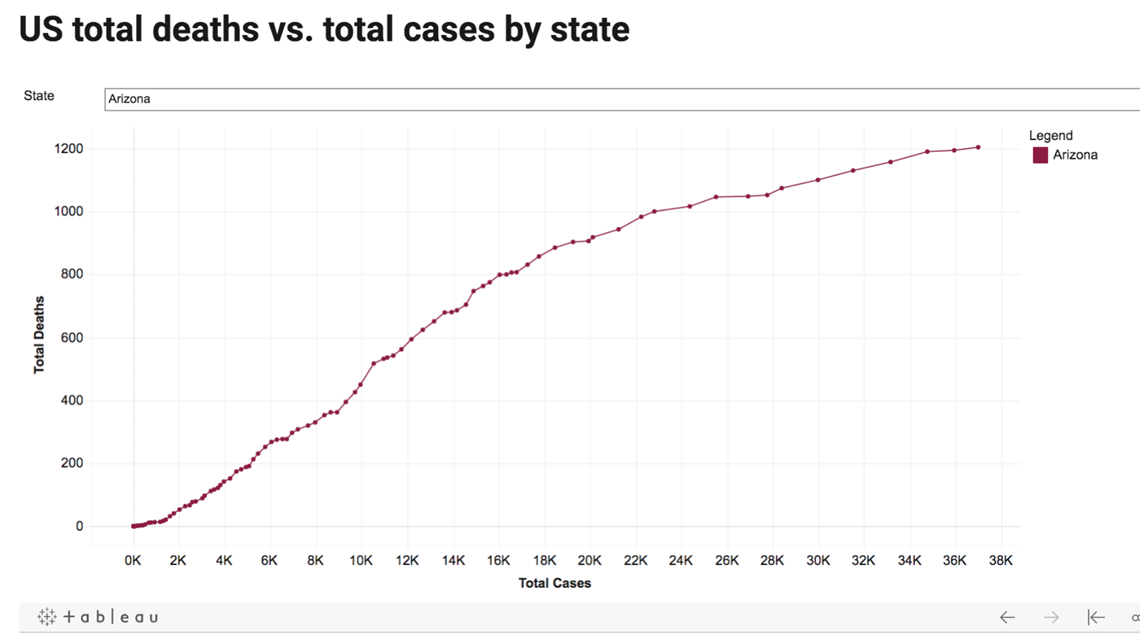
The data set also shows total deaths versus total cases in Arizona by county and nationwide by state. It displays the mortality rate relative those who are infected. The steeper the curve, the higher the mortality rate.
Individual counties in Arizona and individual states can be selected.


The ASU Biodesign Institute's "Critical COVID-19 trends" can be found here. Researchers are expected to hold a press conference Wednesday providing more analysis on the trends.